Dynamic analysis is the process of using tools such as a debugger and instrumentation (or, lets be honest with each other here, mad printf statements), to understand a piece of software that we’re researching. This article will look at getting line-level debugging set up with a remote target, all without source code.
Pulse spends a reasonable amount of time performing static and dynamic analysis. It all folds into our hybrid assessment methodology where we we use a larger bag of tricks to better understand a system and find vulnerabilities. What this practically means is that we ask for things like source code, application binaries and access to the servers running the software that we’re testing. This lets us use a wide array of penetration testing and security research techniques to find bugs, rather than just the old-school black-box techniques of yesteryear. You’d be forgiven for thinking… “well hey, you have source code, or binaries, why not just read the source code or assembly and understand what’s going on” and the issue is a common one that comes up when dealing with IT junk: The load-bearing “just”.
Sometimes, that source code and assembly can be painful to understand in a short time frame. Sometimes, the easiest solution is to set a break point where some security decision is being made, some input is being parsed, or a potentially vulnerable sink exists, and triggering that functionality so you can inspect exactly what’s going on. Why spend days when you can spend hours, you know?
This article has been heavily inspired by Dozer’s write up on debugging Java applications with decompiled source, so lets try do the same thing with dotnet! Sana’s article has a practical example of using these tricks to figure out how templating works in Azure DevOps runners.
Quick disclaimer: Attaching to processes and rummaging around with a debugger makes it easy to crash the debugee. I’d recommend against trying this stuff in a production environment where a crashed web server would have a major impact.
The Testing Setup
We’re going to be using three bits of tech to make this work. Visual Studio or VSCode, ILSpy and SSH. If you’re running the target locally, then look at the dnSpyEx fork which has a decompiler/debugger built into one. You could probably achieve most of this with LLDB if you were an LLDB Amadeus. I am not an LLDB Amadeus, and prefer to work with a slightly friendlier debugger when dealing with dotnet stuff.
Our example setup is replicating a real engagement I worked on. I had remote access to the server running the application I was targeting, and access to application binaries, but no source code, and no included PDB files. The example toy code is available at the bottom of this article. Here’s the setup:
┌──────────────────────────────┐
│                              │
│    ┌───────────────────┐     │
│    │Target Process DLLs|     |
│    |and Decompiled Code|     │
│    └─────────▲─────────┘     │
│              │               │                ┌───────────────────────────────┐
│              │               │                │                               │
│      ┌───────┴─────┐         │                │     ┌───────────────────┐     │
│      │Visual Studio├─────────┼────────────────┼─────►    dotnet Core    │     │
│      └─────────────┘         │     SSH        │     │      Process      │     │
│                              │                │     └───────────────────┘     │
│         Win 10 Test          │                │      Target Linux Server      │
│       Virtual Machine        │                └───────────────────────────────┘
└──────────────────────────────┘
In this case, our target is a simple web API, and we want to hook on a method to see how data is being processed. We call the info endpoint, which takes some user input and uses it to construct a call out to another third-party web service.
$ curl -i http://192.168.122.242:5125/ ; echo
HTTP/1.1 200 OK
Content-Type: text/plain; charset=utf-8
Date: Fri, 14 Apr 2023 07:58:17 GMT
Server: Kestrel
Transfer-Encoding: chunked

Hello World!
$ curl -i http://192.168.122.242:5125/info -X POST -H 'Content-Type: application/json' -d '{"username":"mynewuser"}' ; echo
HTTP/1.1 200 OK
Content-Type: application/json; charset=utf-8
Date: Fri, 14 Apr 2023 07:58:54 GMT
Server: Kestrel
Transfer-Encoding: chunked

"Done"
When I say things like “trip the api” and “fire the curl command” in this article, I mean issue the curl command which POSTs to the info API.
In the real-life-version-this-is-based-on, I wanted to see what data was being passed to the internal API and whether I could use malicious input to control the request in some meaningful way. Using a dynamic debugging setup, the goal is to set a break point in the info API controller, and see how we can influence what’s being sent out from the API.
Obtaining and Decompiling the Target Application
Alright so first thing we need to do is obtain the application binaries. In this case I’m going to SSH into my server that’s running the target app, figure out where it’s running, and nick the application files.
root@app-server:~# ss -ptunal
Netid   State    Recv-Q   Send-Q     Local Address:Port       Peer Address:Port   Process
udp     UNCONN   0        0                0.0.0.0:68              0.0.0.0:*       users:(("dhclient",pid=451,fd=9))
tcp     LISTEN   0        512              0.0.0.0:5000            0.0.0.0:*       users:(("DemoApi",pid=847,fd=168))
tcp     LISTEN   0        128              0.0.0.0:22              0.0.0.0:*       users:(("sshd",pid=482,fd=3))
tcp     LISTEN   0        128                 [::]:22                 [::]:*       users:(("sshd",pid=482,fd=4))
root@app-server:~# ls -l /proc/847/exe
lrwxrwxrwx 1 app app 0 Apr 14 20:12 /proc/847/exe -> /home/app/DemoApi/DemoApi
root@app-server:~# ls -l /home/app/DemoApi/
total 200
-rw-r--r-- 1 app root    127 Apr 14 20:05 appsettings.Development.json
-rw-r--r-- 1 app root    151 Apr 14 20:05 appsettings.json
-rwxr-xr-x 1 app root 151064 Apr 14 20:05 DemoApi
-rw-r--r-- 1 app root    391 Apr 14 20:05 DemoApi.deps.json
-rw-r--r-- 1 app root   8704 Apr 14 20:05 DemoApi.dll
-rw-r--r-- 1 app root    469 Apr 14 20:05 DemoApi.runtimeconfig.json
-rw-r--r-- 1 app root    483 Apr 14 20:05 web.config
root@app-server:~# cd /home/app/
root@app-server:/home/app# ls
DemoApi
root@app-server:/home/app# zip -r /dev/shm/DemoApi.zip DemoApi/
updating: DemoApi/ (stored 0%)
  adding: DemoApi/DemoApi.deps.json (deflated 50%)
  adding: DemoApi/web.config (deflated 39%)
  adding: DemoApi/appsettings.Development.json (deflated 28%)
  adding: DemoApi/appsettings.json (deflated 26%)
  adding: DemoApi/DemoApi (deflated 64%)
  adding: DemoApi/DemoApi.runtimeconfig.json (deflated 49%)
  adding: DemoApi/DemoApi.dll (deflated 54%)
Above, we find which process is holding open the listening port and figure out where the app files are. These are then zipped up, and copied over to the windows testing VM. Next, we copy the zip file to our testing VM and open DemoApi.dll in ILSpy.
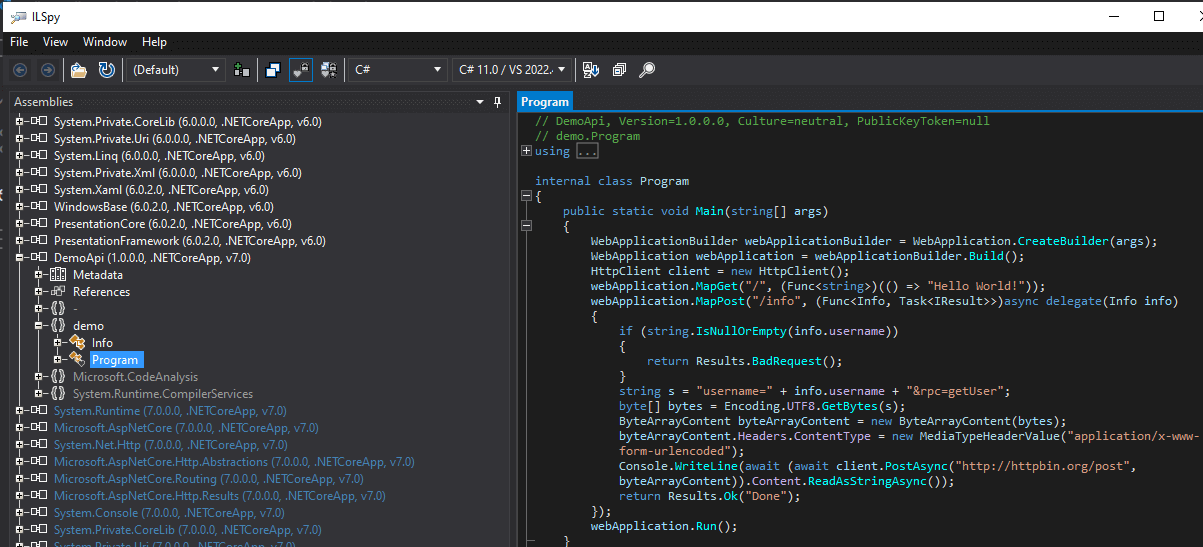
Above, you can see the decompiled anonymous method which implements the info API. This is where we want to set up our break point and see how user input is being passed into the HttpClient.
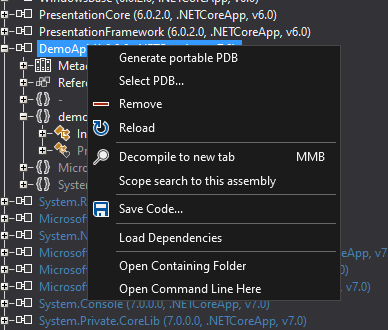
Now normally you can run something like dotPeek symbol server and call it job done. Unfortunately, since we’re debugging a remote target, we’ll need to generate the PDB ourselves and copy it back to the remote server for Visual Studio to play nice. I’ve had some issues with dotPeek’s symbol servers while targeting remote servers, since it seems that the remote vsdbg is doing the heavy lifting. The generate-and-copy approach for target PDBs seems to be more robust.
We right-click and save the Portable PDB file, and also right-click and save the code. Now we have a PDB that’s generated by ILSpy, as well as source code generated by ILSpy. Meaning, our the info in the PDB and the decompiled source code we have should match (in theory! More on this shortly). We’re not changing the code that’s executing in any way, we’re just making our decompiled source and the available PDB correctly match what’s currently running on the web server.
I’ve saved the code to ~\source\DemoApi. The PDB was saved to ~\targets\DemoApi on my Windows testing VM, right next to the looted DLL. Then, I copy the PDB file over to the target server:
PS C:\Users\DoI\targets\DemoApi> scp .\DemoApi.pdb [email protected]:DemoApi/
DemoApi.pdb                                                                               100% 1692   814.7KB/s   00:00
PS C:\Users\DoI\targets\DemoApi>
What’s in a PDB anyway?
Whether you have a PDB file for the target or are using dotPeek to generate the PDB file from decompiled source via it’s symbol server, it’s important to understand what exactly you’re getting with a PDB in dotnet. The PDB (in this case a Portable PDB) contains various information on method definitions, local parameter names, original source file numbers, etcetera.
The debugger uses this information to understand how to debug the target. When you say “I want to set a break point on Program.cs, line 25” or “break whenever local variable foo is read”, the debugger uses the PDB information to figure out how to make this happen. All we’re trying to do at this point is create a PDB that matches our decompiled source code to the target binary in some semi-accurate way.
We’re using ILSpy to decompile the target and provide a PDB that can make this work without the original source code. If you wanted to set a break point on some dotnet library method (like say System.Net.Http.HttpClient.PostAsync), you could avoid the PDB copying step entirely since we don’t need any specific information about the target code itself to set that breakpoint.
In the dotnet world, there is a huge amount of information packed into the binary itself, which is how decompilers like ILSpy and dotPeek do what they do. We don’t need PDB files for our targets since the majority of the information which helps us while reverse engineering is packed into the binary itself. You can set break points based on method names with no debug data at all, since that information is included in the binary. This information can be obfuscated, but that’s a discussion for another time.
Remote Debugging Setup - Visual Studio
Now that we understand roughly how PDBs work and how to generate source code from target DLLs; we can fire up Visual Studio. Select the ‘continue without code’ option on the project screen (you don’t need to open the saved source yet). Under the Tools->Options->Debugging->General, uncheck the Enable Just My Code and Require source files to exactly match the original version options, and tick the Suppress JIT optimization on module load (Managed only).
Next we need to configure the remote target server. I’ve already loaded an ssh key for the app user that’s running the DemoApi target code. Select Attach from the Run menu. Configure the host after selecting SSH (or whatever other transport mechanism you like):
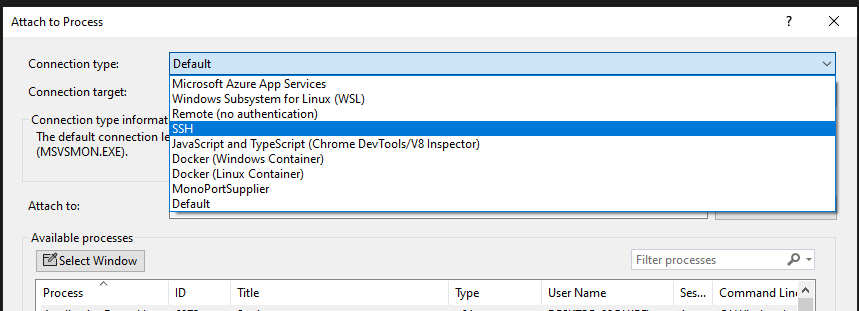
Select a process and hit connect:
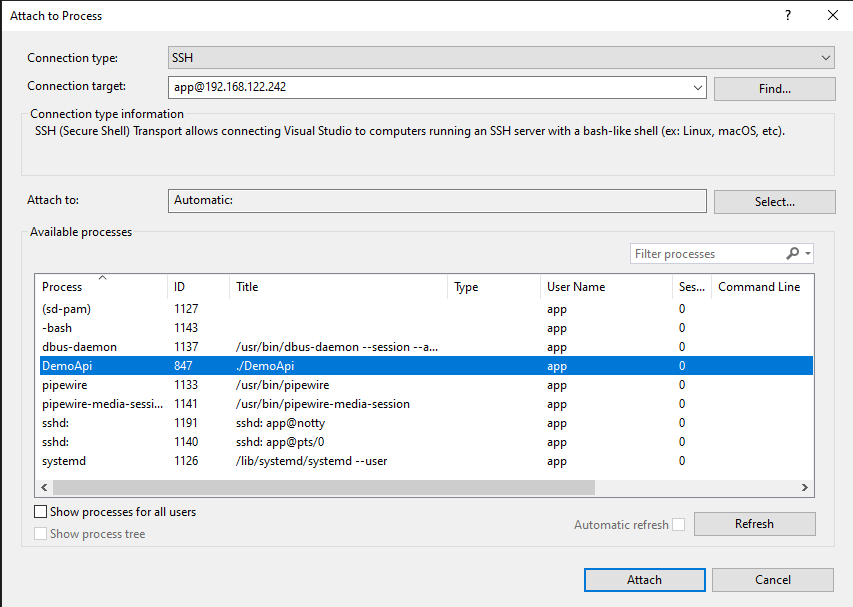
If you get an error about .vs_debugger not being available, you may need to manually create the directory (in my case, /home/app/.vs_debugger). The remote debugging process will download vsdbg and execute it on the remote host. If you run ps on the remote host during the initial connection you can see what it’s doing:
app         1324    1307  0 22:00 ?        00:00:00 /bin/sh /home/app/.vs-debugger/GetVsDbg.sh -v vs2022 -u -l /home/app/.vs-debugger/vs2022 -a /home/app/.vs-debugger/GetVsDbg.sh -o
app         1339    1324  4 22:00 ?        00:00:00 wget -q https://vsdebugger.azureedge.net/vsdbg-17-6-10208-1/vsdbg-linux-x64.tar.gz -O vsdbg-linux-x64.tar.gz
When you connect to a process via SSH, Visual Studio is remoting in and launching vsdbg, then communicating with that process:
app         1346    1307  0 22:00 ?        00:00:00 /bin/sh /home/app/.vs-debugger/GetVsDbg.sh -v vs2022 -u -l /home/app/.vs-debugger/vs2022 -d vscode -a /remote_debugger
app         1355    1346  0 22:00 ?        00:00:00 /home/app/.vs-debugger/vs2022/vsdbg --interpreter=vscode
After the remote is set up, check out the Debug -> Window -> Modules window and you can make sure all of the various PDBs and such have been loaded:
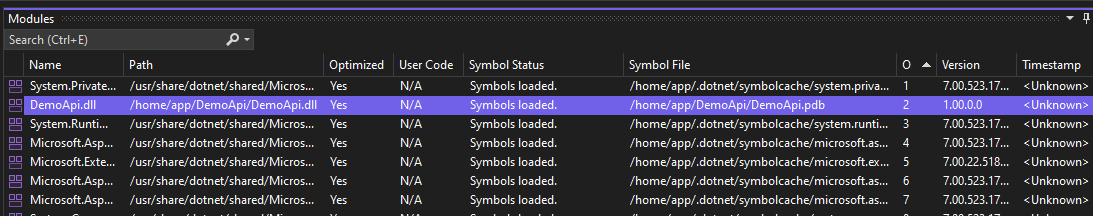
Notice we have our ILSpy-ed PDB loaded for the DemoApi.dll on the server. Now, it’s time to set a break point.
Breakpoints in Library Methods
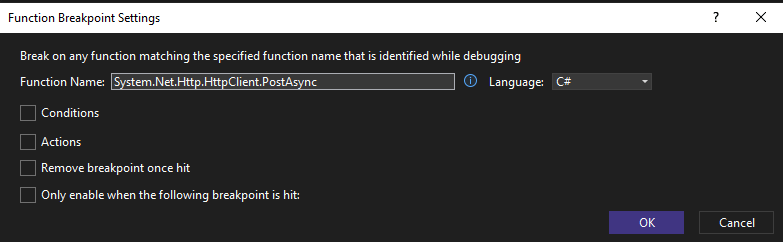
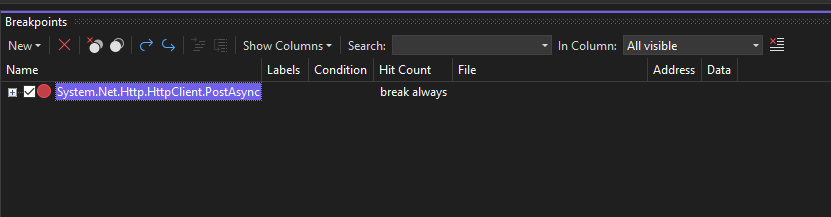
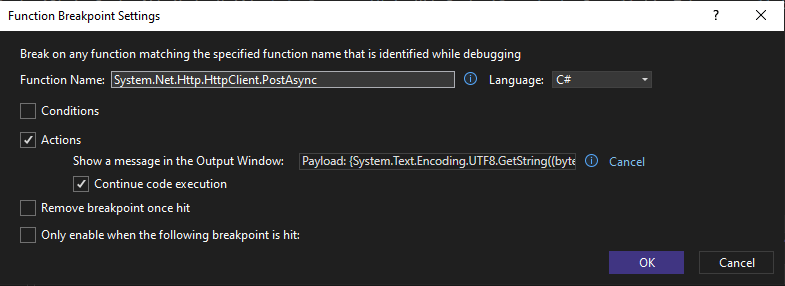
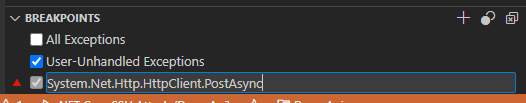
If you want to set a breakpoint in a dotnet library method, you don’t even need to do the PDB step. You can simply attach to the process and configure a break point. In this case I’m choosing the PostAsync method, since that’s what’s being used by the API to call out and will contain the user input I want to look at. You can hit the New button in the breakpoints window and configure a function level break point:
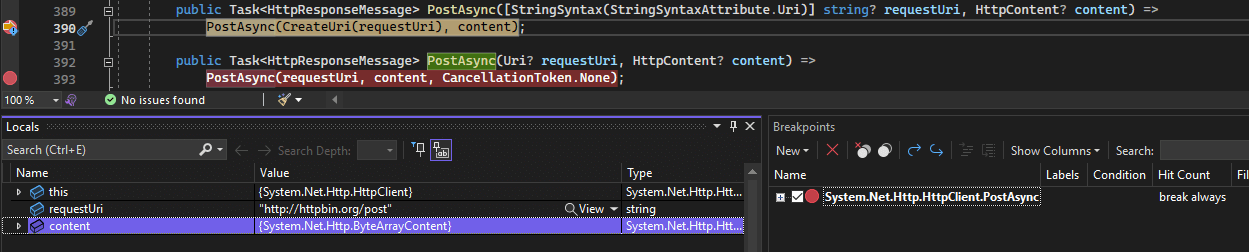
Now after running the curl command to hit the info API, the breakpoint is tripped and we see what’s going on:
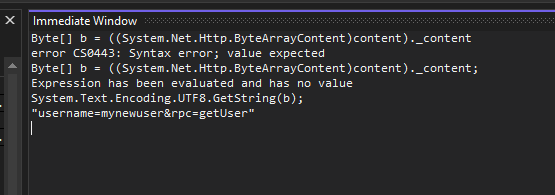
We can also use the immediate window and execute whatever C# we need to understand what’s going on:
All the other usual Visual Studio tricks work, including setting actions on break points and logging useful data to the output window:
Now we can fire all the curl requests we like, and watch the Output window in Visual Studio to see what data is getting sent out after parsing user input:
The thread 0x3086 has exited with code 0 (0x0).
The thread 0x3087 has exited with code 0 (0x0).
Payload: "username=mynewuser&rpc=getUser"
Payload: "username=mynewuser&rpc=getUser"
Payload: "username=omgtesting&rpc=getUser"
Payload: "username=omgtesting&rpc=getUser"
Breakpoints in Decompiled Code
Since the aim of the game is to debug using decompiled code, we can use file -> open -> file to open up a specific .cs file and set a breakpoint. In this case I’m browsing to ~\source\DemoApi\demo\Program.cs and setting a line level breakpoint:

Since the PDB on the remote target and source are both generated by ILSpy, the break point gets set and we can trip this new break point by issuing another curl command to the API:

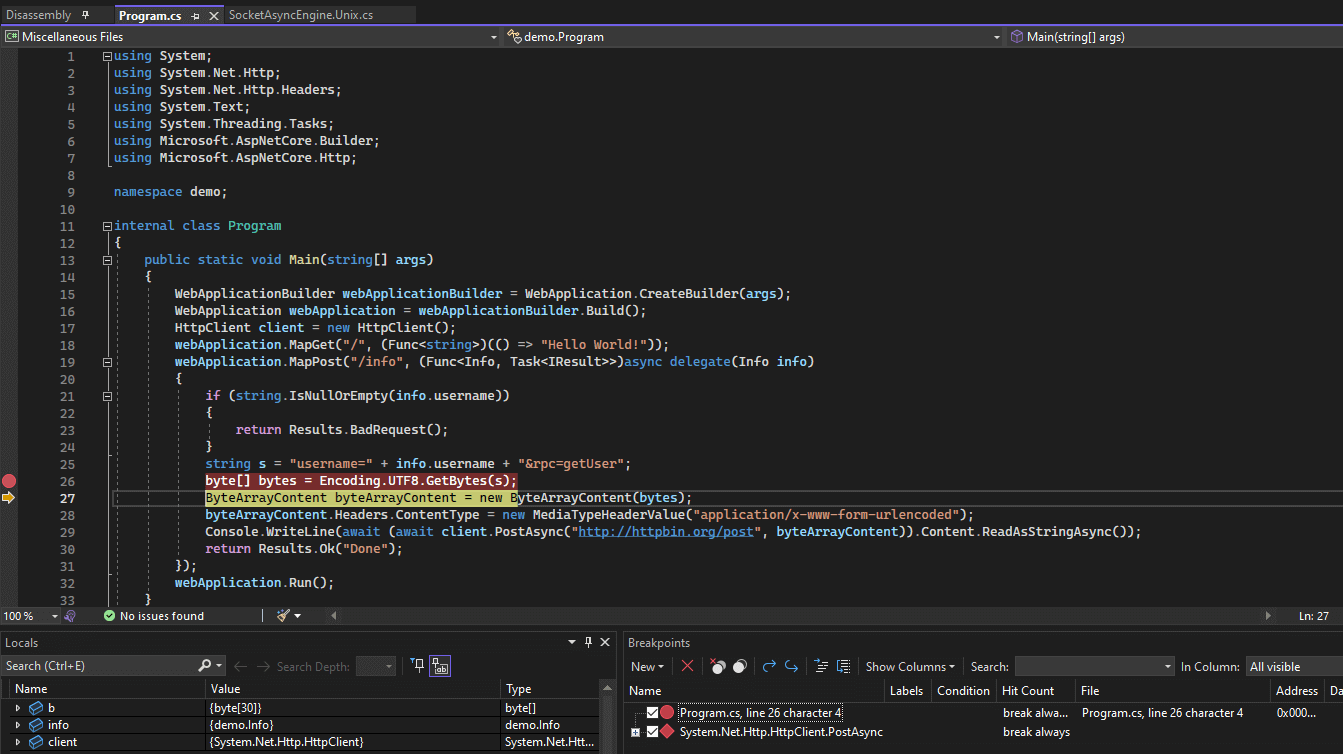
However, if we hit the ‘step-into’, we notice a small problem:
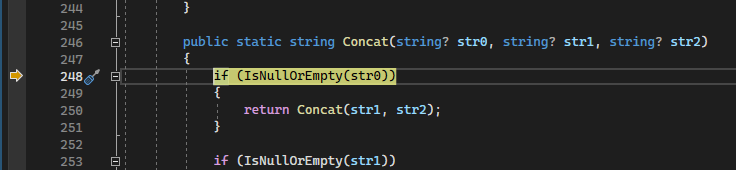
Ruh roh, it’s stepped into Concat, where we’re expecting GetBytes(). These is a discrepancy between the PDB file generated by ILSpy, and the source code generated.
This means we can get in the rough ballpark, see calling parameters and locals, and so forth, but accurate source level debugging isn’t going to happen without more work. Unfortunately, the Disassembly windows reports No disassembly available., so we can’t even see the IL code.
This solution is okay. Not great, but okay. The bonus with Visual Studio for me is the immediate window, which comes in super handy for checking out various logic and calling functions directly in remote targets while reverse engineering.
Thankfully, there is a more accurate source-level debugging option. Which brings us to the next option….
Remote Debugging Setup - VSCode and Omnisharp
Debugging dotnet with VSCode is also a thing, and sometimes easier to set up since it doesn’t require a full-fat Visual Studio install. Omnisharp has some slick features, including auto-decompile if the PDB file is present. Since we have a trick for generating the PDB file, we can take full advantage of this when reverse engineering.
Remember how Visual Studio is spawning vsdbg on the target host? Well, we can also spawn vsdbg ourselves and stuff the relevant data for the remote into the Omnisharp Debugger. The Omnisharp GitHub page has a decent wiki page on attaching to remote processes..
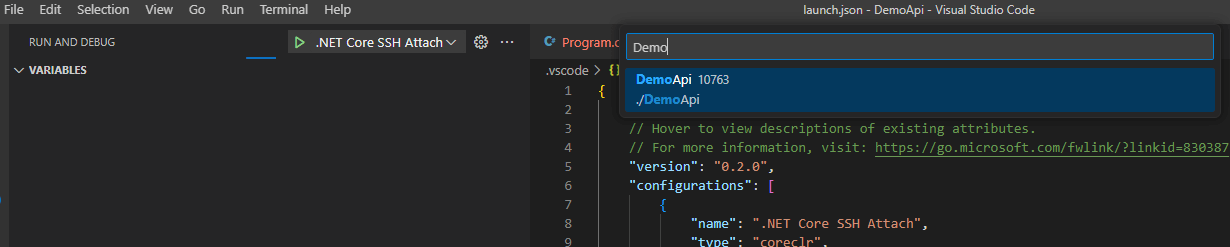
First, open up VSCode and install the C# extensions. Hit Run -> Add Configurations which will generate the tasks.json file. There are a few additional options we need to enable, just like with Visual Studio. Specifically, we need to disable Just My Code and Exact Source (more info on this and other flags is in the Omnisharp wiki). I’ve also enabled the Microsoft symbol server search and turned on suppression of JIT optimizations, just in case we hit some functionality that hasn’t been JIT-ed yet and can get some better debugging experiences.
My tasks.json configuration for the SSH remote ended up like this:
{
    "version": "0.2.0",
    "configurations": [
        {
            "name": ".NET Core SSH Attach",
            "type": "coreclr",
            "request": "attach",
            "processId": "${command:pickRemoteProcess}",
            "pipeTransport": {
                "pipeProgram": "ssh",
                "pipeArgs": [ "-T", "[email protected]" ],
                "debuggerPath": "~/.vs-debugger/vs2022/vsdbg",
                "pipeCwd": "${workspaceRoot}",
                "quoteArgs": true
            },
            "justMyCode": false,
            "requireExactSource": false,
            "suppressJITOptimizations": true,
            "symbolOptions": {
                "searchMicrosoftSymbolServer": true
            }
        }
    ]
}
Hit the debug button and you’ll be prompted with a process selector:
The console window shows that we’ve connected, and since we did the sneaky copy over of the PDB file it finds the symbols for DemoApi just fine:
Starting: "ssh" -T [email protected] "~/.vs-debugger/vs2022/vsdbg --interpreter=vscode"
-------------------------------------------------------------------
You may only use the Microsoft .NET Core Debugger (vsdbg) with
Visual Studio Code, Visual Studio or Visual Studio for Mac software
to help you develop and test your applications.
-------------------------------------------------------------------
Loaded '/usr/share/dotnet/shared/Microsoft.NETCore.App/7.0.5/System.Private.CoreLib.dll'. Symbols loaded.
Loaded '/home/app/DemoApi/DemoApi.dll'. Symbols loaded.
Loaded '/usr/share/dotnet/shared/Microsoft.NETCore.App/7.0.5/System.Runtime.dll'. Symbols loaded.
...yoink...
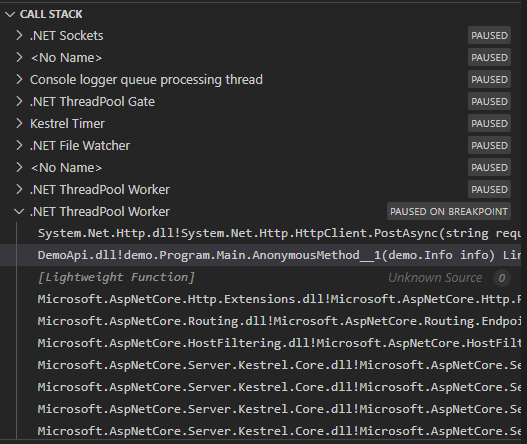
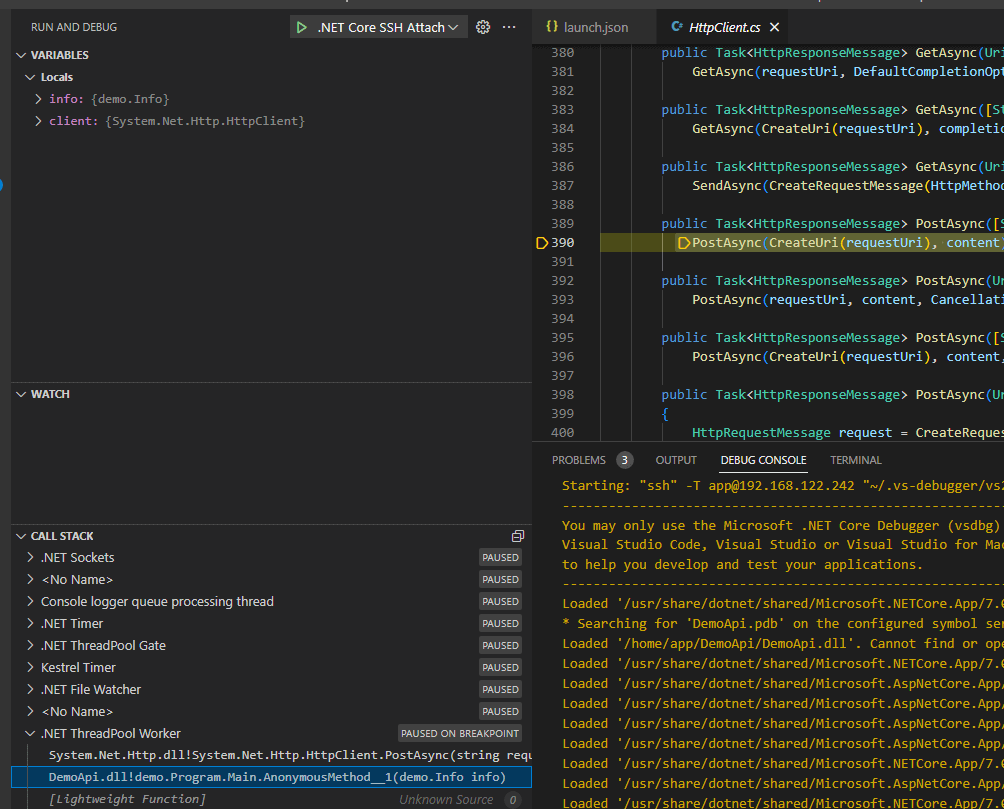
I can set a breakpoint in System.Net.Http.HttpClient just like before, and then fire a curl command a the API to trip it:
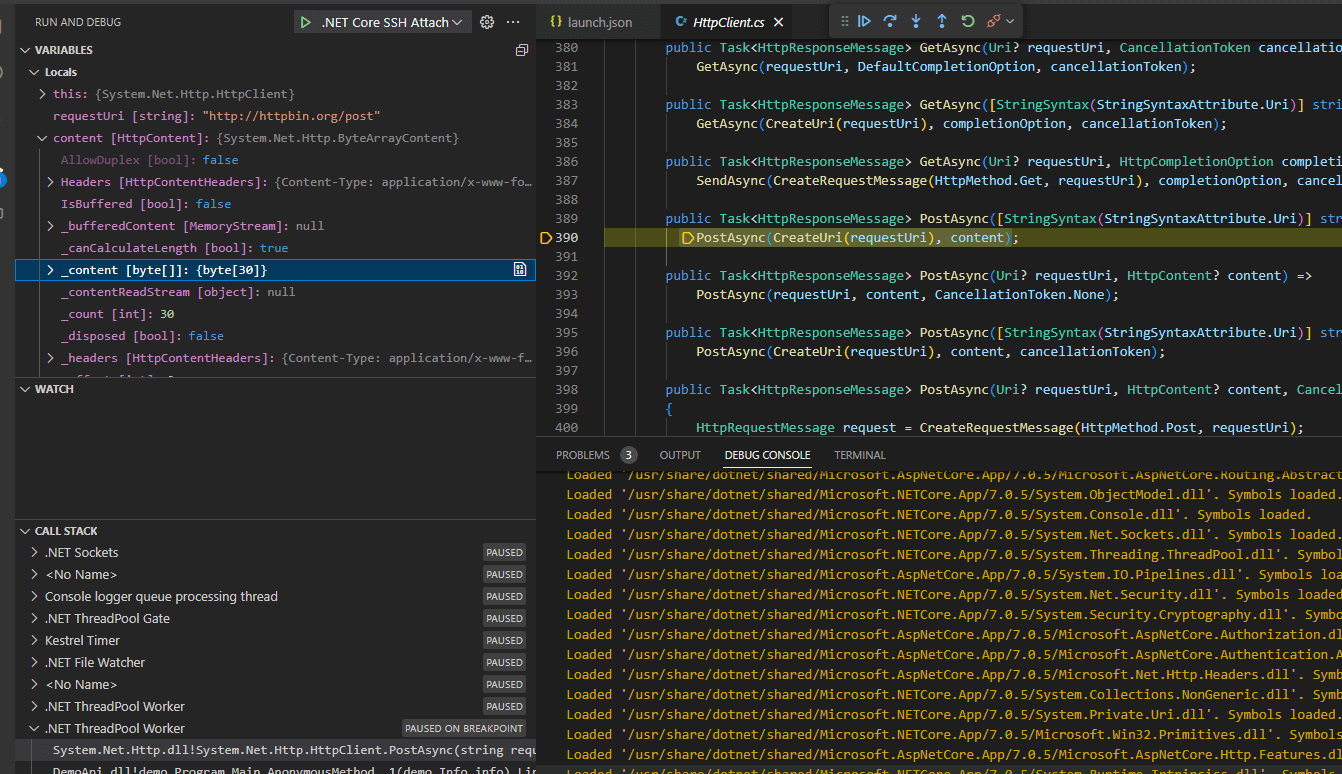
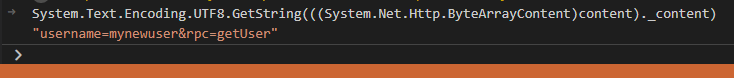
We can use the debug console to execute expressions. Below, I’m running System.Text.Encoding.UTF8.GetString(((System.Net.Http.ByteArrayContent)content)._content) via the debug console to get the data that’ll be sent.
Looking at the call stack, you can see the DemoApi lambda. Clicking on that triggers auto decompilation of the source, since we have sneakily uploaded our generated PDB:
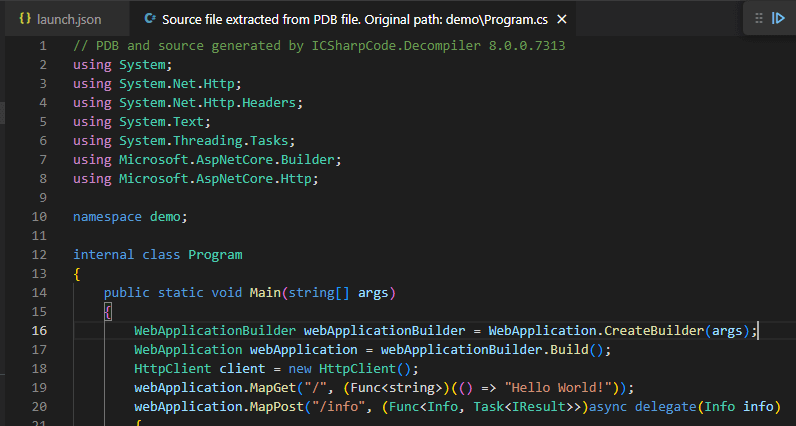
We can set our source-level break points, shown here on the GetBytes() call:
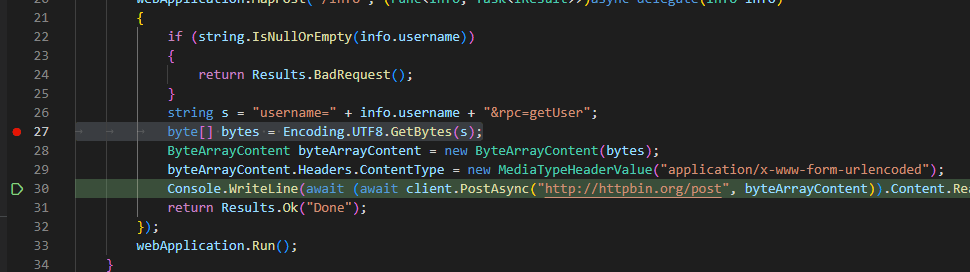
Fire another curl command to trip the API and the break point gets hit:
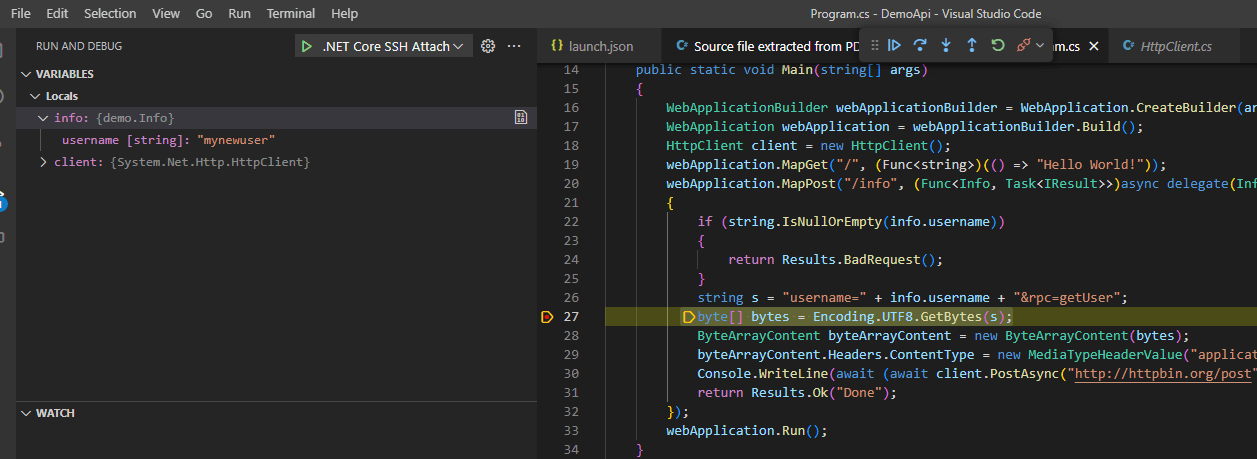
We get our locals, which can also happily modify:
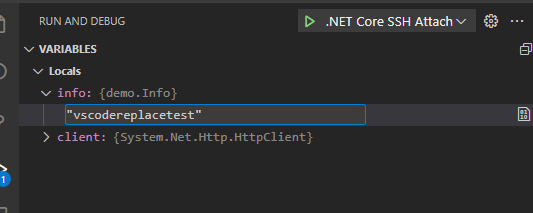
Remember how Visual Studio had the problem with the source line numbers not being accurate? Let’s try the same thing here, and click ‘step in’:
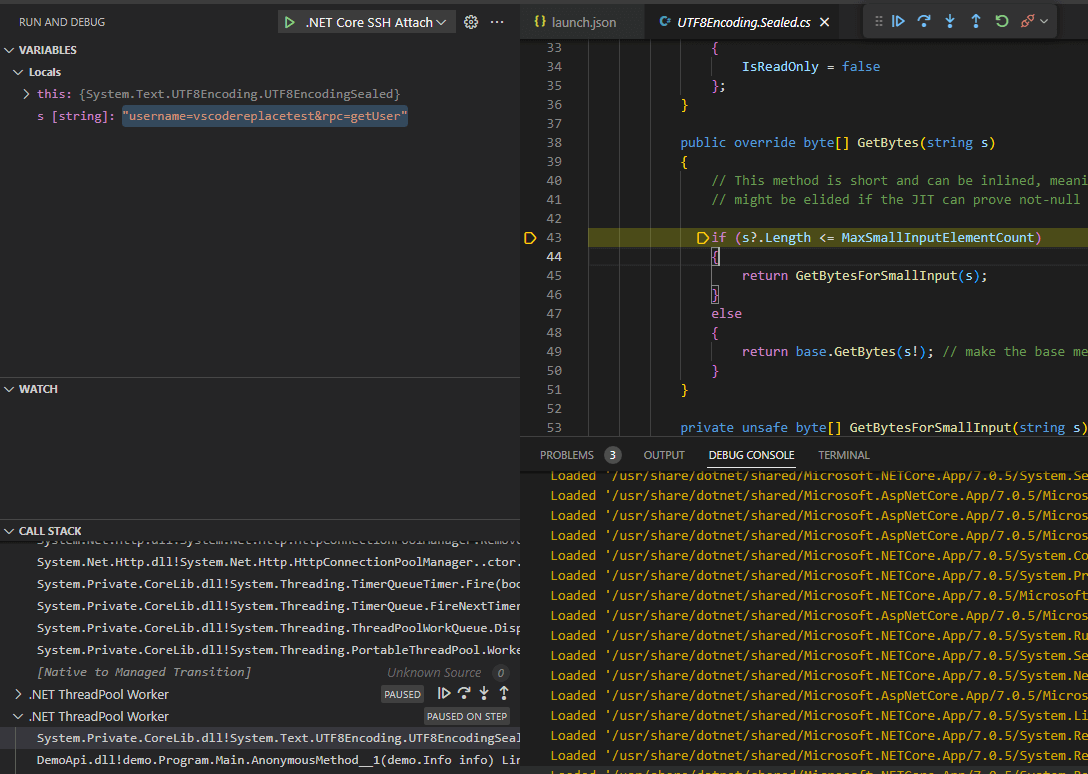
Success! We end up in the GetBytes method as expected. Since Omnisharp is providing the source code, and that’s also what we’re using to debug, our line level debugging is accurate. Omnisharp has an accurate relationship between the decompiled code served back to the user and the debugging environment.
If we don’t have the PDB, the console connection will come up with:
Loaded '/usr/share/dotnet/shared/Microsoft.NETCore.App/7.0.5/System.Private.CoreLib.dll'. Symbols loaded.
* Searching for 'DemoApi.pdb' on the configured symbol servers...............
Loaded '/home/app/DemoApi/DemoApi.dll'. Cannot find or open the PDB file.
And then when we clicky on the DemoApi function in the call stack, we get no slick auto-decompile generation:
Summary
When reverse engineering dotnet code and doing dynamic analysis, I’m going to be reaching for VSCode and Omnisharp. Uploading a PDB generated by ILSpy and getting accurate source level debugging is neat. The main thing I miss with this setup is Visual Studio’s immediate window. Sometimes it’s easier to break in a specific method and execute some exploratory C# code directly in the context of the debugee to figure out what’s going on, and VSCode’s debug console expressions aren’t quite on the same level as the immediate window functionality yet.
To wrap up, the process is basically this:
- Obtain the DLL/EXE you’re targeting
- Generate a PDB file and a source project with ILSpy
- Copy the PDB file back over to the target
- Attach either Visual Studio or VSCode’s debugger and get debugging!
I’ve found dynamic analysis to be very useful when dealing with targets that are more challenging to understand, or when I needed to get answers to specific questions quickly. Hopefully, you’ll find these techniques useful too.
Toy Code
I’ve purposefully made this example with lambdas, since it’s a case in remote debugging where we can’t easily specify a break point just on method name. I’ve been tripped up by remote debugging targets making heavy use of lambdas and now I can share my plight with you all.
using System;
using System.IO;
using System.Net.Http;
using System.Net.Http.Headers;

namespace demo {
        public class Info {
                public string? username { get; set; }
        }

        class Program {
                public static void Main(string[] args) {
                        var builder = WebApplication.CreateBuilder(args);
                        var app = builder.Build();
                        HttpClient client = new HttpClient();

                        app.MapGet("/", () => "Hello World!");

                        app.MapPost("/info", async (Info info) =>
                        {
                                if(String.IsNullOrEmpty(info.username)){
                                        return Results.BadRequest();
                                }

                                // build the request
                                var content = "username="+info.username+"&rpc=getUser";
                                var buffer = System.Text.Encoding.UTF8.GetBytes(content);
                                var byteContent = new ByteArrayContent(buffer);
                                byteContent.Headers.ContentType = new MediaTypeHeaderValue("application/x-www-form-urlencoded");

                                var response = await client.PostAsync("http://httpbin.org/post", byteContent);
                                var responseString = await response.Content.ReadAsStringAsync();
                                Console.WriteLine(responseString);

                                return Results.Ok("Done");
                        });

                        app.Run();
                }
        }
}
BONUS ROUND 1 - Wait, what was the bug?!
Ok ok so we’ve gone through all this and I haven’t mentioned what the actual vulnerability was. In this case, user input is being used to construct a request body out to a third-party API. Specifically, these lines:
// build the request
var content = "username="+info.username+"&rpc=getUser";
When issuing this request, you can set your username to myusername&someotherparameter=foo and add additional parameters into the body which is being POSTed by the API. What other parameters are supported? Can we overwrite the value of the rpc field through parameter pollution? What happens when you set your username to myusername&rpc=addUser&username=newadmin&password=m9ej898qnygjrcfygiewgig6guyh&isAdmin=true? What other parameters can we inject and control?
The issue is that the expected user input is a simple username; however, we can inject an ampersand character and subsequently inject additional form parameters. A better way to write this would be:
var d = new Dictionary<string, string>();
d.Add("username", info.username);
d.Add("rpc", "getUser");
content = new FormUrlEncodedContent(d);
The FormUrlEncodedContent call should handle input escaping, and any sneaky & characters will get encoded to %26.
BONUS ROUND 2 - LLDB
You made it this far, congrats. I mentioned LLDB earlier, which is LLVM’s debugger. Microsoft maintain SOS, which is an LLDB plugin to work with dotnet managed code. If you suffer from the same damage as I, you’ll no doubt end up in LLDB on some whacky server trying to remember how to set a breakpoint on a dotnet library method and analyze the parameters. Here’s how you can do that with our current example.
I’m using LLDB directly on the target host here, and have installed the SOS plugin using Microsoft’s guide. The following snippet shows finding the System.Net.Http module, setting a breakpoint on PostAsync, then checking out the parameters:
(lldb) process attach -p 8203
Process 8203 stopped
(lldb) clrmodules
00007F5B22B40000 00B33400 /usr/share/dotnet/shared/Microsoft.NETCore.App/7.0.5/System.Private.CoreLib.dll
00007F5B9D699000 00002200 /home/app/DemoApi/DemoApi.dll
00007F5B9D691000 00008000 /usr/share/dotnet/shared/Microsoft.NETCore.App/7.0.5/System.Runtime.dll
00007F5B23890000 00063200 /usr/share/dotnet/shared/Microsoft.AspNetCore.App/7.0.5/Microsoft.AspNetCore.dll
00007F5B23910000 0005A400 /usr/share/dotnet/shared/Microsoft.AspNetCore.App/7.0.5/Microsoft.Extensions.Hosting.Abstractions.dll
00007F5B23970000 00097A00 /usr/share/dotnet/shared/Microsoft.AspNetCore.App/7.0.5/Microsoft.AspNetCore.Http.Abstractions.dll
00007F5B23A10000 0010D800 /usr/share/dotnet/shared/Microsoft.AspNetCore.App/7.0.5/Microsoft.AspNetCore.Routing.dll
00007F5B23B40000 00052200 /usr/share/dotnet/shared/Microsoft.NETCore.App/7.0.5/System.ComponentModel.dll
00007F5B23BA0000 00055C00 /usr/share/dotnet/shared/Microsoft.AspNetCore.App/7.0.5/Microsoft.Extensions.Features.dll
00007F5B23C00000 001FA400 /usr/share/dotnet/shared/Microsoft.NETCore.App/7.0.5/System.Net.Http.dll
...yoink...
(lldb) name2ee System.Net.Http.dll System.Net.Http.HttpClient.PostAsync
Module:      00007f5b23b31ee0
Assembly:    System.Net.Http.dll
Token:       00000000060001DC
MethodDesc:  00007f5b23b34a08
Name:        System.Net.Http.HttpClient.PostAsync(System.String, System.Net.Http.HttpContent)
JITTED Code Address: 00007f5b23c3edb0
-----------------------
Token:       00000000060001DD
MethodDesc:  00007f5b23b34a20
Name:        System.Net.Http.HttpClient.PostAsync(System.Uri, System.Net.Http.HttpContent)
Not JITTED yet. Use 'bpmd -md 00007F5B23B34A20' to break on run.
-----------------------
Token:       00000000060001DE
MethodDesc:  00007f5b23b34a38
Name:        System.Net.Http.HttpClient.PostAsync(System.String, System.Net.Http.HttpContent, System.Threading.CancellationToken)
Not JITTED yet. Use 'bpmd -md 00007F5B23B34A38' to break on run.
-----------------------
Token:       00000000060001DF
MethodDesc:  00007f5b23b34a50
Name:        System.Net.Http.HttpClient.PostAsync(System.Uri, System.Net.Http.HttpContent, System.Threading.CancellationToken)
JITTED Code Address: 00007f5b23c3ee80
(lldb) bpmd System.Net.Http.dll System.Net.Http.HttpClient.PostAsync
MethodDesc = 00007F5B23B34A08
MethodDesc = 00007F5B23B34A20
MethodDesc = 00007F5B23B34A38
MethodDesc = 00007F5B23B34A50
Setting breakpoint: breakpoint set --address 0x00007F5B23C3EE99 [System.Net.Http.HttpClient.PostAsync(System.Uri, System.Net.Http.HttpContent, System.Threading.CancellationToken)]
Setting breakpoint: breakpoint set --address 0x00007F5B23C3EDC2 [System.Net.Http.HttpClient.PostAsync(System.String, System.Net.Http.HttpContent)]
Adding pending breakpoints...
(lldb) continue
Process 8203 resuming
After setting the breakpoint, I fire the curl command and the break point is hit. I can then look at the CLR stack and check out the various parameters. Note the whacky method definition in the Program class. This is how lambda functions end up in dotnet IL.
(lldb)
Process 8203 stopped
* thread #19, name = '.NET ThreadPool', stop reason = breakpoint 2.1
    frame #0: 0x00007f5b23c3edc2
->  0x7f5b23c3edc2: movq   %rsi, %rdi
    0x7f5b23c3edc5: callq  *0x143515(%rip)
    0x7f5b23c3edcb: movq   %rax, %r15
    0x7f5b23c3edce: callq  *0x140f9c(%rip)
(lldb) clrstack -a
OS Thread Id: 0x2978 (19)
        Child SP               IP Call Site
00007F1A75436E50 00007F5B23C3EDC2 System.Net.Http.HttpClient.PostAsync(System.String, System.Net.Http.HttpContent) [/_/src/libraries/System.Net.Http/src/System/Net/Http/HttpClient.cs @ 390]
    PARAMETERS:
        this (<CLR reg>) = 0x00007f1b1147e9f0
        requestUri (<CLR reg>) = 0x00007f1b114ef840
        content (<CLR reg>) = 0x00007f1b11585f90

00007F1A75436E80 00007F5B237F34DE demo.Program+<>c__DisplayClass0_0+<<Main>b__1>d.MoveNext() [demo\Program.cs @ 30]
    PARAMETERS:
        this (0x00007F1A75436F38) = 0x00007f1a75436fc0
    LOCALS:
        0x00007F1A75436F34 = 0x00000000ffffffff
        0x00007F1A75436F28 = 0x00007f1b1140ff88
        0x00007F1A75436F20 = 0x0000000000000000
        0x00007F1A75436F18 = 0x00007f1b11585f00
        0x00007F1A75436F10 = 0x00007f1b11585f58
        0x00007F1A75436F08 = 0x00007f1b11585f90
        0x00007F1A75436F00 = 0x0000000000000000
...yoink...
(lldb) dumpobj 0x00007f1b114ef840
Name:        System.String
MethodTable: 00007f5b23821038
EEClass:     00007f5b23776fc0
Tracked Type: false
Size:        68(0x44) bytes
File:        /usr/share/dotnet/shared/Microsoft.NETCore.App/7.0.5/System.Private.CoreLib.dll
String:      http://httpbin.org/post
Fields:
              MT    Field   Offset                 Type VT     Attr            Value Name
00007f5b236fe378  40002b9        8         System.Int32  1 instance               23 _stringLength
00007f5b23725e48  40002ba        c          System.Char  1 instance               68 _firstChar
00007f5b23821038  40002b8       d8        System.String  0   static 00007f1b11400218 Empty
(lldb) dumpobj 0x00007f1b11585f90
Name:        System.Net.Http.ByteArrayContent
MethodTable: 00007f5b27071818
EEClass:     00007f5b27053fd8
Tracked Type: false
Size:        64(0x40) bytes
File:        /usr/share/dotnet/shared/Microsoft.NETCore.App/7.0.5/System.Net.Http.dll
Fields:
              MT    Field   Offset                 Type VT     Attr            Value Name
00007f5b27073048  40000b7        8 ...ttpContentHeaders  0 instance 00007f1b11585ff0 _headers
00007f5b26417408  40000b8       10 ...m.IO.MemoryStream  0 instance 0000000000000000 _bufferedContent
00007f5b22a99300  40000b9       18        System.Object  0 instance 0000000000000000 _contentReadStream
00007f5b236fae78  40000ba       20       System.Boolean  1 instance                0 _disposed
00007f5b236fae78  40000bb       21       System.Boolean  1 instance                1 _canCalculateLength
00007f5b238220b8  40000bc       b0 System.Text.Encoding  0   static 00007f1b114129c0 DefaultStringEncoding
00007f5b2446a7f8  4000030       28        System.Byte[]  0 instance 00007f1b11585f58 _content
00007f5b236fe378  4000031       30         System.Int32  1 instance                0 _offset
00007f5b236fe378  4000032       34         System.Int32  1 instance               30 _count
(lldb) mem read 00007f1b11585f58 -c 128
0x7f1b11585f58: f8 a7 46 24 5b 7f 00 00 1e 00 00 00 00 00 00 00  ..F$[...........
0x7f1b11585f68: 75 73 65 72 6e 61 6d 65 3d 6d 79 6e 65 77 75 73  username=mynewus
0x7f1b11585f78: 65 72 26 72 70 63 3d 67 65 74 55 73 65 72 00 00  er&rpc=getUser..
0x7f1b11585f88: 00 00 00 00 00 00 00 00 18 18 07 27 5b 7f 00 00  ...........'[...
0x7f1b11585f98: f0 5f 58 11 1b 7f 00 00 00 00 00 00 00 00 00 00  ._X.............
0x7f1b11585fa8: 00 00 00 00 00 00 00 00 00 01 00 00 00 00 00 00  ................
0x7f1b11585fb8: 58 5f 58 11 1b 7f 00 00 00 00 00 00 1e 00 00 00  X_X.............
0x7f1b11585fc8: 00 00 00 00 00 00 00 00 e8 33 07 27 5b 7f 00 00  .........3.'[...
Now we can mess with the data in memory and resume execution:
(lldb) mem write 0x7f1b11585f68 -s4 0x41424344
(lldb) mem read 00007f1b11585f58 -c 128
0x7f1b11585f58: f8 a7 46 24 5b 7f 00 00 1e 00 00 00 00 00 00 00  ..F$[...........
0x7f1b11585f68: 44 43 42 41 6e 61 6d 65 3d 6d 79 6e 65 77 75 73  DCBAname=mynewus
0x7f1b11585f78: 65 72 26 72 70 63 3d 67 65 74 55 73 65 72 00 00  er&rpc=getUser..
0x7f1b11585f88: 00 00 00 00 00 00 00 00 18 18 07 27 5b 7f 00 00  ...........'[...
0x7f1b11585f98: f0 5f 58 11 1b 7f 00 00 00 00 00 00 00 00 00 00  ._X.............
0x7f1b11585fa8: 00 00 00 00 00 00 00 00 00 01 00 00 00 00 00 00  ................
0x7f1b11585fb8: 58 5f 58 11 1b 7f 00 00 00 00 00 00 1e 00 00 00  X_X.............
0x7f1b11585fc8: 00 00 00 00 00 00 00 00 e8 33 07 27 5b 7f 00 00  .........3.'[...
(lldb) continue
Now we look at the console log of the server response and can see value has been changed before getting sent out.
{
  "args": {},
  "data": "",
  "files": {},
  "form": {
    "DCBAname": "mynewuser",
    "rpc": "getUser"
  },
  "headers": {
    "Content-Length": "30",
    "Content-Type": "application/x-www-form-urlencoded",
    "Host": "httpbin.org",
  },
  "json": null,
  "url": "http://httpbin.org/post"
}
Effectively driving LLDB for the purposes of messing with dotnet requires a decent understanding of dotnet IL internals as well as lower-level debugging concepts, so I’m not going to dig into this much further with this article. Every time I have to remember how to LLDB with dotnet, the Microsoft SOS debugging page and SOS help file pages are my first go to.
I mentioned earlier that debugging processes increases the chance of crashing them due to our antics. In my experience with LLDB debugging dotnet junk on Linux so far, I’ve sometimes crashed the target process by simply setting breakpoints or attempting to cleanly detach from the process. Take care!